Chapter 2 Internal models of visual search are rich, person-specific, and mostly accurate
Matan Mazor, Max Siegel & Joshua B. Tenenbaum
Having an internal model of one’s attention can be useful for effectively managing limited perceptual and cognitive resources. For example, in the previous Chapter I argued that knowledge of the attentional capture of shape or colour singletons allows participants to immediately recognize the absence of objects in displays. While this and other work has hinted to the existence of an internal model of attention, it is still unknown how rich and flexible this model is, whether it corresponds to one’s own attention or alternatively to a generic person-invariant schema, and whether it is specified as a list of facts and rules, or alternatively as a probabilistic simulation model. To this end, we designed a task to test participants’ ability to estimate their own behavior in a visual search task with novel displays. In four online experiments (two exploratory and two pre-registered), prospective search time estimates reflected accurate metacognitive knowledge of key findings in the visual search literature, including the set-size effect, higher efficiency of feature- over conjunction- searches, and visual search asymmetry for familiar and unfamiliar stimuli. We further find that participants’ estimates fit better with their own search times compared to the search times of other participants. Together, we interpret our findings as suggesting that people hold an internal model of visual search that is rich, person specific, and mostly accurate.
2.1 Introduction
In order to efficiently interact with the world, agents construct mental models: simplified representations of the environment and of other agents that are accurate enough to generate useful predictions and handle missing data (Forrester, 1971; Friston, 2010; Tenenbaum, Kemp, Griffiths, & Goodman, 2011). For example, participants’ ability to predict the temporal unfolding of physical scenes has been attributed to an ‘intuitive physics engine’: a simplified model of the physical world that uses approximate, probabilistic simulations to make rapid inferences (Battaglia, Hamrick, & Tenenbaum, 2013). Similarly, having a simplified model of planning and decision-making allows humans to infer the beliefs and desires of other agents based on their observed behaviour (Baker, Saxe, & Tenenbaum, 2011). Finally, in motor control, an internal model of one’s motor system and body allows subjects to monitor and control their body (Wolpert, Ghahramani, & Jordan, 1995). This internal forward model has also been proposed to play a role in differentiating self and other (Blakemore, Wolpert, & Frith, 1998). In recent years, careful experimental and computational work has advanced our understanding of these internal models: their scope, the abstractions that they make, and the consequences of these abstractions for faithfully and efficiently modeling the environment.
Agents may benefit from having a simplified model not only of the environment, other agents, and their motor system, but also of their own perceptual, cognitive and psychological states. Chapter 1 demonstrated the utility in a mental self-model for efficient inference about absence without task experience. But the utility in a mental self-model goes beyond visual search. For example, it has been suggested that knowing which items are more subjectively memorable is useful for making negative recognition judgments [“I would have remembered this object if I saw it”; Brown, Lewis, & Monk (1977)]. Similarly, children guided their decisions and evidence accumulation based on model-based expectations about the perception of hidden items (Siegel, Magid, Pelz, Tenenbaum, & Schulz, 2021). In the context of perception and attention, Graziano & Webb (2015) argued that having a simplified Attention Schema - a simplified model of attention and its dynamics - is crucial for monitoring and controlling one’s attention, similar to how a body-schema supports motor control.
Indeed, people are not only capable of predicting the temporal unfolding of physical scenes, or the behaviour of other agents, but also the workings of their own attention under hypothetical scenarios. In one study, participants held accurate beliefs about the serial nature of visual search for a conjunction of features, and the parallel nature of visual search for a distinct color (Levin & Angelone, 2008). Similarly, the majority of third graders knew that the addition of distractors makes finding the target harder, particularly if the distractors and target are of the same color (Miller & Bigi, 1977). These and similar studies established the existence of metacognitive knowledge about visual search, as a result raising new questions about its structure, limits, and origins. We identify three such open questions. First, do internal models of visual search represent search difficulty along a continuum, or alternatively classify search displays as being either ‘easy’ or ‘hard?’ Second, to what extent is knowledge about visual search learned or calibrated based on first-person experience? And third, are internal models of visual search structured as a list of facts and laws, or as an approximate probabilistic simulation?
Here we take a first step toward providing answers to these three questions, using visual search as our model test case for internal models of perception and attention more generally. Participants estimated their prospective search times in visual search tasks and then performed the same searches. Similar to using colliding balls (Smith & Vul, 2013) and falling blocks (Battaglia, Hamrick, & Tenenbaum, 2013) to study intuitive physics, here we chose visual search for being thoroughly studied and for following robust behavioural laws. In Experiments 1 and 2, we used simple colored shapes as our stimuli, and compared participants’ internal models to scientific theories of attention that distinguish parallel from serial processing. We found that participants represented the relative efficiency of different search tasks along a continuum, but had a persistent bias to assume serial search. In experiments 3 and 4 we used unfamiliar stimuli from the Omniglot dataset (Lake, Salakhutdinov, Gross, & Tenenbaum, 2011) with the purpose of testing the richness and compositional nature of participants’ internal models, and their reliance on person-specific knowledge. We find that participants do remarkably well in predicting their search times for novel stimuli. Furthermore, we show that internal models of visual search are person-specific, in that they are better fitted to one’s own search behaviour compared with the search behaviour of other participants. Although estimation time analysis failed to provide direct evidence for online simulation, we suggest that a graded, person-specific representation of visual search is most consistent with a simulation account.
2.2 Experiments 1 and 2: shape, orientation, and color
An internal model of visual search may take a similar form to that of a scientific theory, by specifying an ontology of concepts and a set of causal laws that operate over them (Gerstenberg & Tenenbaum, 2017; Gopnik & Meltzoff, 1997). For example, participants may hold an internal model of visual search that is similar to Anne Treisman’s Feature Integration Theory. According to this theory, visual search comprises two stages: a pre-attentive parallel stage, and a serial focused attention stage (A. Treisman, 1986; A. Treisman & Sato, 1990). In the first stage, visual features (such as color, orientation, and intensity) are extracted from the display to generate spatial ‘feature maps.’ Targets that are defined by a single feature with respect to their surroundings can be located based on these feature maps alone (feature search; for example searching for a red car in a road full of yellow taxis). Since the extraction of a feature map is pre-attentive, in these cases search can be completed immediately. In contrast, sometimes the target can only be identified by integrating over multiple features (conjunction search; for example if the road has not only yellow taxis, but also red buses). In such cases, attention must be serially deployed to items in the display until the target is identified.
A simplifying assumption of Feature Integration Theory is that there is no transfer of information between the pre-attentive and focused attention stages. In other words, observers cannot selectively direct their focused attention to items that produced strong activations in the pre-attentive stage. Guided Search models (J. M. Wolfe, 1994, 2021; J. M. Wolfe, Cave, & Franzel, 1989) assume instead that participants use these pre-attentive guiding signals in their serial search. Compared to Feature Integration Theory, Guided Search models provide much better fit to empirical data, at the expense of being more complex and rich in detail. To date, it is unknown where do internal models of visual search fall on this performance-complexity trade-off: do people differentiate between ‘easy’ and ‘hard’ searches like in Feature Integration Theory, or do they represent search difficulty on a continuum, more like Guided Search?
In Experiments 1 and 2 we used stimuli that lend themselves to a categorical distinction between parallel and serial search: simple geometrical shapes of different colors and orientations. We asked whether participants’ internal models of visual search predict which search displays demand serial deployment of attention and which don’t. Critically, participants gave their search time estimates before they were asked to perform searches involving these or similar stimuli, so their search time estimates reflected prior beliefs about search efficiency. Experiment 2 was designed to replicate and generalize the results of Exp. 1 to a new stimulus dimension (orientation) and distractor set sizes. Our hypotheses and analysis plan for Experiment 2, based on the results of Experiment 1, were pre-registered prior to data collection (pre-registration document: osf.io/2dpq9). Raw data and full analysis scripts are available at github.com/matanmazor/metaVisualSearch.
2.2.1 Participants
For Exp. 1, 100 participants (no demographic data was collected) were recruited from Amazon’s crowdsourcing web-service Mechanical Turk. Exp. 1 took about 20 minutes to complete. Each participant was paid $2.50. The highest performing 30% of participants received an additional bonus of $1.50. For Exp. 2, 100 participants (median reported age: 35.00; range: [19-80]) were recruited from the Prolific crowdsourcing web-service. The experiment took about 15 minutes to complete. Each participant was paid £1.5. The highest performing 30% of participants received an additional bonus of £1.
2.2.2 Procedure
The study was built using the Lab.js platform (Henninger, Shevchenko, Mertens, Kieslich, & Hilbig, 2019) and hosted on a JATOS server (Lange, Kühn, & Filevich, 2015). Static versions of all four experiments are available at github.com/matanmazor/metaVisualSearch.
Familiarization
First, participants were acquainted with the visual search task. The instructions for this part were as follows:
In the first part, you will find a target hidden among distractors. First, a gray cross will appear on the screen. Look at the cross. Then, the target and distractors will appear. When you spot the target, press the spacebar as quickly as possible. Upon pressing the spacebar, the target and distractors will be replaced by up to 5 numbers. To move to the next trial, type in the number that replaced the target.
The instructions were followed by four trials of an example visual search task (searching for a T among 7 Ls). Feedback was delivered on speed and accuracy. The purpose of this part of the experiment was to familiarize participants with the task.
Estimation
After familiarization, participants estimated how long it would take them to perform various visual search tasks involving novel stimuli and various set sizes. On each trial, they were presented with a target stimulus and a display of distractors and were asked to estimate how long it would take to find the target if it was hidden among the distractors (see Fig. 2.1).
To motivate accurate estimates, we explained that these visual search tasks will be performed in the last part of the experiment, and that bonus points will be awarded for trials in which participants detect the target as fast or faster than their search time estimate. The number of points awarded for a successful search changed as a function of the search time estimate according to the rule \(points=\frac{1}{\sqrt{secs}}\). This rule was chosen for being exponential with respect to the log response times, incentivizing participants to be consistent in their ratings across short and long search tasks (see Appendix C.1). The report scale ranged from 0.1 to 4 seconds in Exp. 1 and to 2 seconds in Exp. 2.
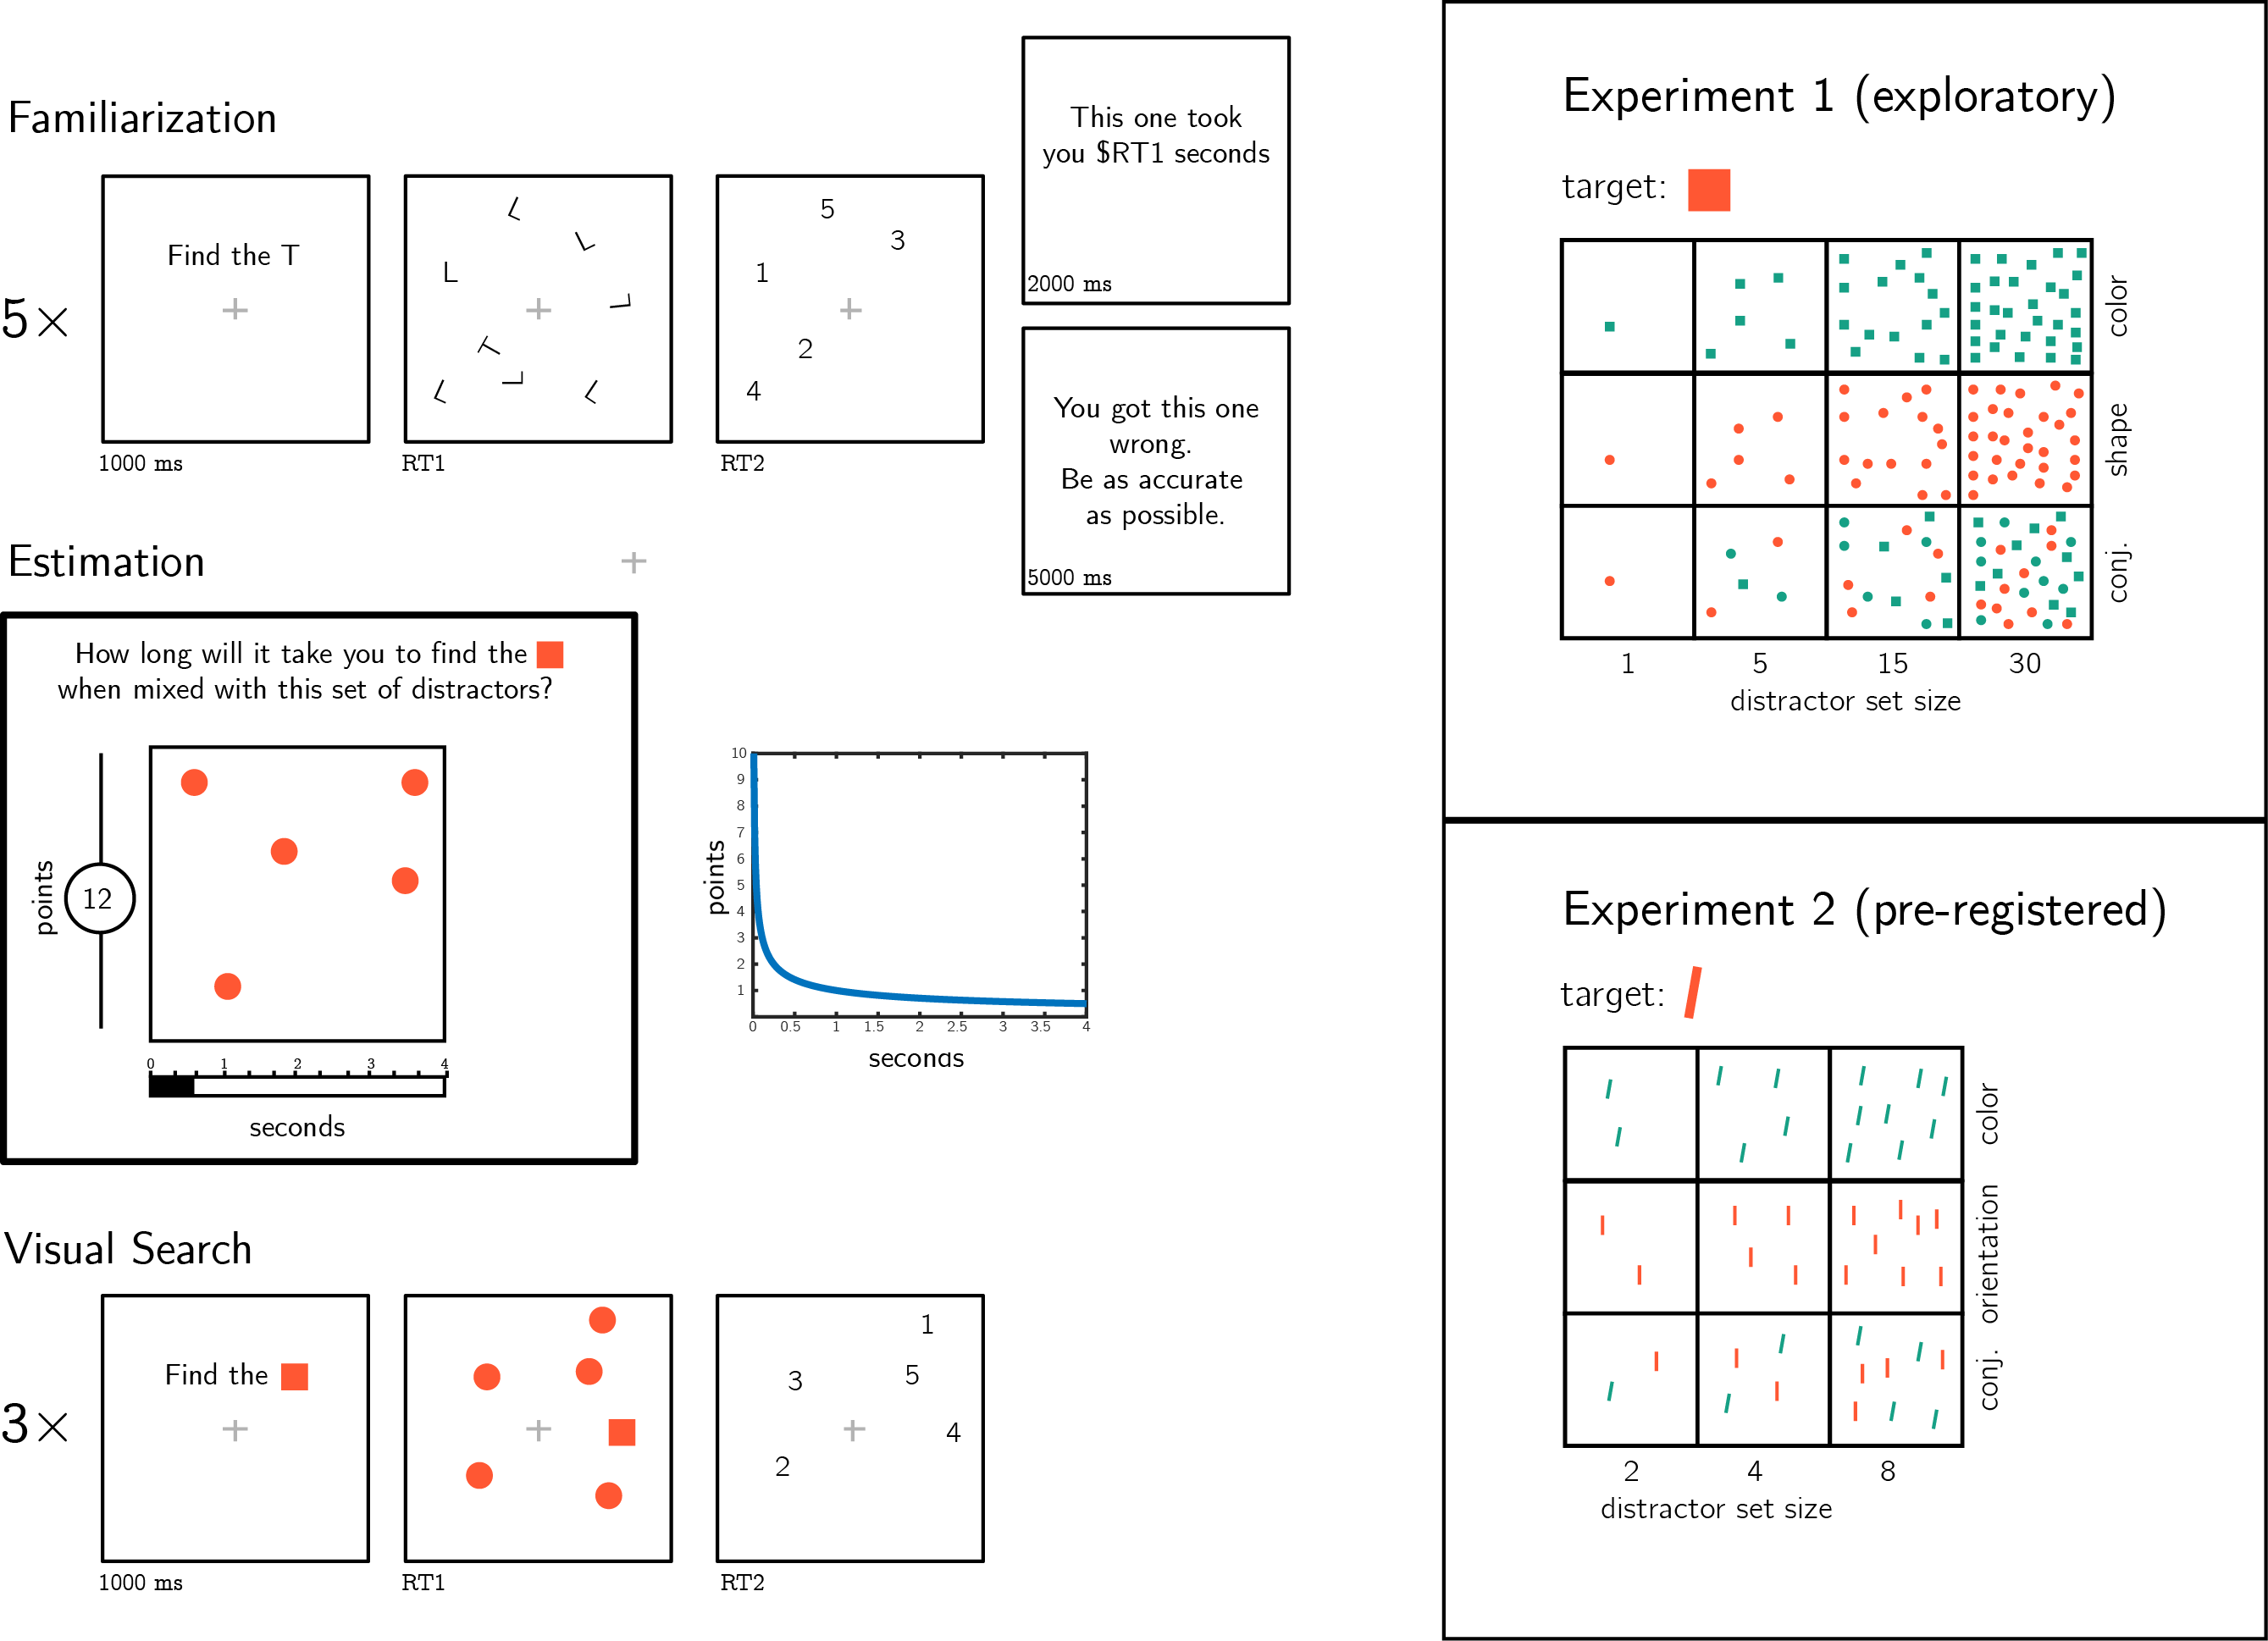
Figure 2.1: Experimental design. Participants first performed five similar visual search trials and received feedback about their speed and accuracy. Then, they were asked to estimate the duration of novel visual search tasks. Bonus points were awarded for accurate estimates, and more points were awarded for risky estimates. Finally, in the visual search part participants performed three consecutive trials of each visual search task for which they gave a search time estimates. Right panels: stimuli used for Experiments 1 and 2.
After one practice trial (estimating search time for finding one T among 3 randomly positioned Ls), we turned to our stimuli of interest. In Experiment 1, participants estimated how long it would take them to find a red (#FF5733) square among green (#16A085) squares (color condition), red circles (shape condition) and a mix of green squares, red circles, and green circles (shape-color conjunction condition), for set sizes 1, 5, 15 and 30. Together, participants estimated the expected search time of 12 different search tasks (see Figure 2.1, upper right panel). In Experiment 2, participants rated how long it would take them to find a red tilted bar (20° off vertical) among green titled bars (color condition), red vertical bars (orientation condition) and a mix of green tilted and red vertical bars (orientation-color conjunction condition) for set sizes 2, 4, and 8. Together, participants estimated the expected search time of 9 different search tasks (see Figure 2.1, lower right panel). In both experiments, the order of estimation trials was randomized between participants.
Visual Search
Participants performed three consecutive search tasks for each of the 12 (Exp. 1) or 9 (Exp. 2) search types. The order of presentation was randomized between participants. No feedback was delivered about speed. To motivate accurate responses, error trials were followed by a 5-second pause.
2.2.3 Results
Accuracy in the visual search task was reasonably high in both Experiments (Exp. 1: \(M = 0.93\), 95% CI \([0.90\), \(0.96]\); Exp. 2: \(M = 0.82\), 95% CI \([0.77\), \(0.87]\)). Error trials and visual search trials that took shorter than 200 milliseconds or longer than 5 seconds were excluded from all further analysis. Participants were excluded if more than 30% of their trials were excluded based on the aforementioned criteria, leaving 89 and 74 participants for the main analysis of Experiments 1 and 2, respectively.
Search times
For each participant and distractor type, we extracted the slope of the function relating RT to distractor set size. As expected, search slopes for color search were not significantly different from zero in Exp. 1 (-0.40 ms/item; \(t(88) = -0.45\), \(p = .652\), \(\mathrm{BF}_{\textrm{01}} = 7.74\)) and Exp. 2 (0.51 ms/item; \(t(73) = 0.07\), \(p = .946\), \(\mathrm{BF}_{\textrm{01}} = 7.80\)). This is consistent with color being a basic feature that is not dependent on serial attention for its extraction by the visual system (A. Treisman, 1986; A. Treisman & Sato, 1990). The slope for shape search was close, but significantly higher than zero (5.66 ms/item; \(t(88) = 4.35\), \(p < .001\)), and the slope for orientation was numerically higher than zero (11.05 ms/item) but not significantly so (\(t(73) = 1.50\), \(p = .139\), \(\mathrm{BF}_{\textrm{01}} = 2.70\)). In both Experiments, conjunction search gave rise to search slopes significantly higher than zero (Exp. 1: 14.80 ms/item (\(t(88) = 9.16\), \(p < .001\); Exp. 2: 72.14 ms/item (\(t(73) = 7.50\), \(p < .001\); see Figure 2.2).
Estimation accuracy
We next turned to analyze participants’ prospective search time estimates, and their alignment with actual search times. In both Experiments, participants generally overestimated their search times. This was the case for all search types across the two Experiments (see Figure 2.2, left panels: all markers are above the dashed \(x=y\) diagonal). This is expected, based on our bonus scheme that incentivized conservative estimates (see Appendix C.1). Despite this bias, estimates were correlated with true search times, supporting a metacognitive insight into visual search behaviour (see Fig. 2.2, left panels. Within subject Spearman correlations, Exp. 1: \(M = 0.28\), 95% CI \([0.21\), \(0.35]\), \(t(88) = 7.77\), \(p < .001\); Exp 2: \(M = 0.16\), 95% CI \([0.07\), \(0.26]\), \(t(73) = 3.48\), \(p = .001\)).
To test participants’ internal models of visual search, we analyzed their estimates as if they were search times, and extracted estimation slopes relating estimates to the number of distractors in the display (see Fig. 2.2, right panels). Estimation slopes (expected ms/item) were steeper than search slopes for all search types. In particular, although search time for a deviant color was unaffected by the number of distractors, participants estimated that color searches with more distractors should take longer (mean estimated slope in Exp. 1: 17.76 ms/item; \(t(88) = 6.35\), \(p < .001\); in Exp 2: 29.43 ms/item; \(t(73) = 2.63\), \(p = .010\)). In other words, at the group level, participants showed no metacognitive insight into the parallel nature of color search.
Although they were significantly different from zero, in both Experiments estimation slopes for color search were significantly shallower than for conjunction search (Exp. 1: \(t(88) = 4.08\), \(p < .001\), Exp. 2: \(t(73) = 3.87\), \(p < .001\)). In contrast, although true search slopes were shallower for shape and orientation than for conjunction (p’s<0.001), the difference in estimation slopes was not significant (difference between shape and conjunction slopes: \(t(88) = 1.65\), \(p = .103\); difference between orientation and conjunction slopes: \(t(73) = 1.18\), \(p = .244\)).
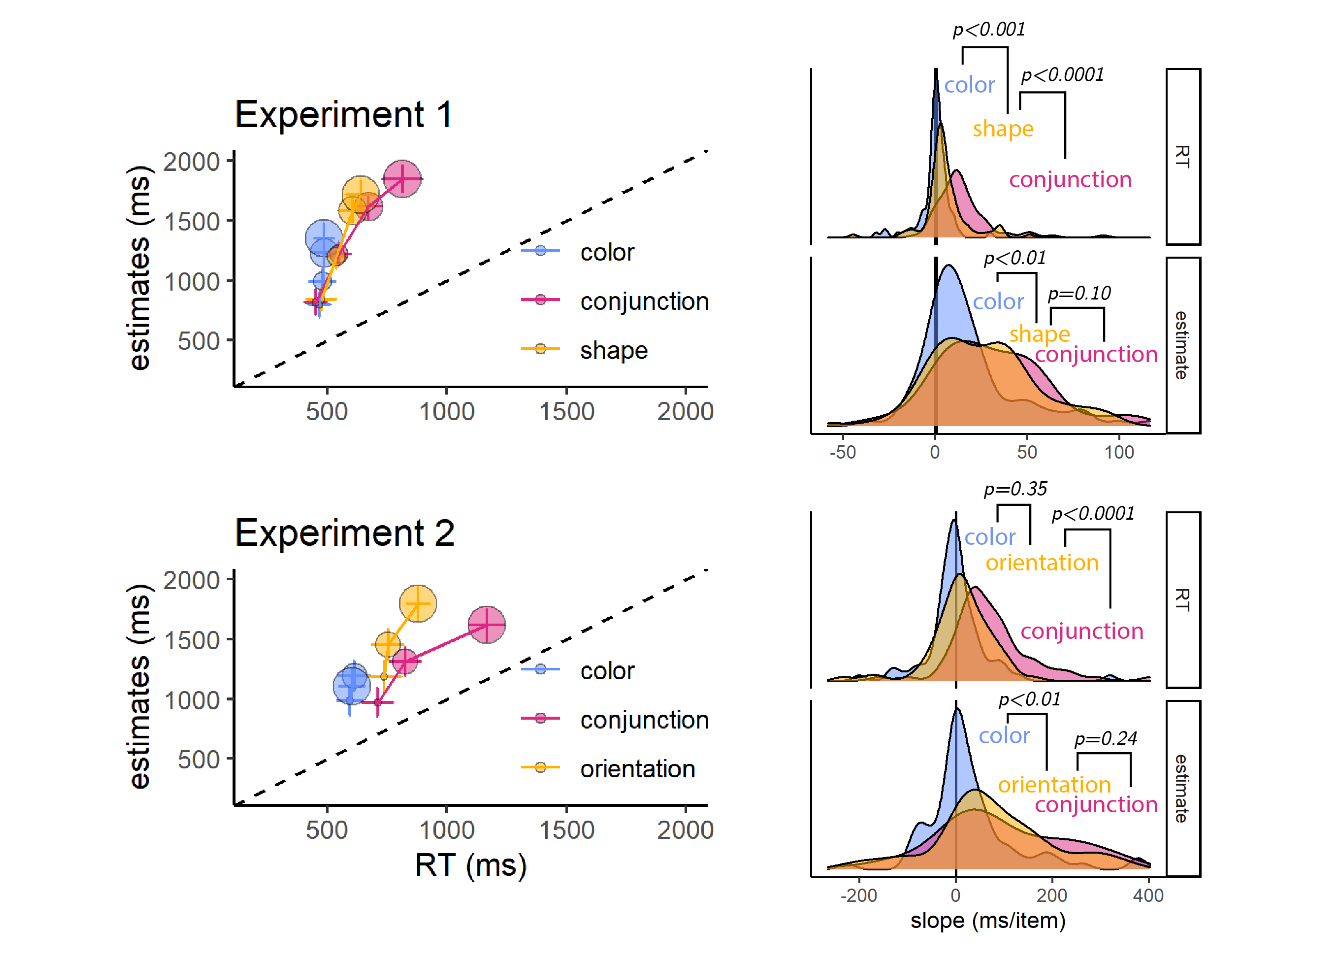
Figure 2.2: Left panels: median estimated search times plotted against true search times for the different search types (coded by color), and set sizes (coded by circle size; from small to large), for Exp. 1 (upper panel) and 2 (lower panel). Error bars represent the standard error of the median. Right panels: distribution of search (top) and estimated (bottom) slopes for the three search types in Exp. 1 (upper panel) and 2 (lower panel). The dashed line indicates \(y=x\).
A graded representation of search efficiency
In Feature Integration Theory, searches come in two flavours: parallel and serial. If participants’ model of visual search shares this simplifying assumption, the results from the previous section indicate that their models also wrongly specify that shape and orientation searches are serial just like conjunction search. In contrast, an internal model of visual search may represent search efficiency along a continuum, with some searches being highly efficient, some highly inefficient, and others fall somewhere in between the two ends. This is more in line with Guided Search models (Hoffman, 1979; J. M. Wolfe, 2021; J. M. Wolfe, Cave, & Franzel, 1989).
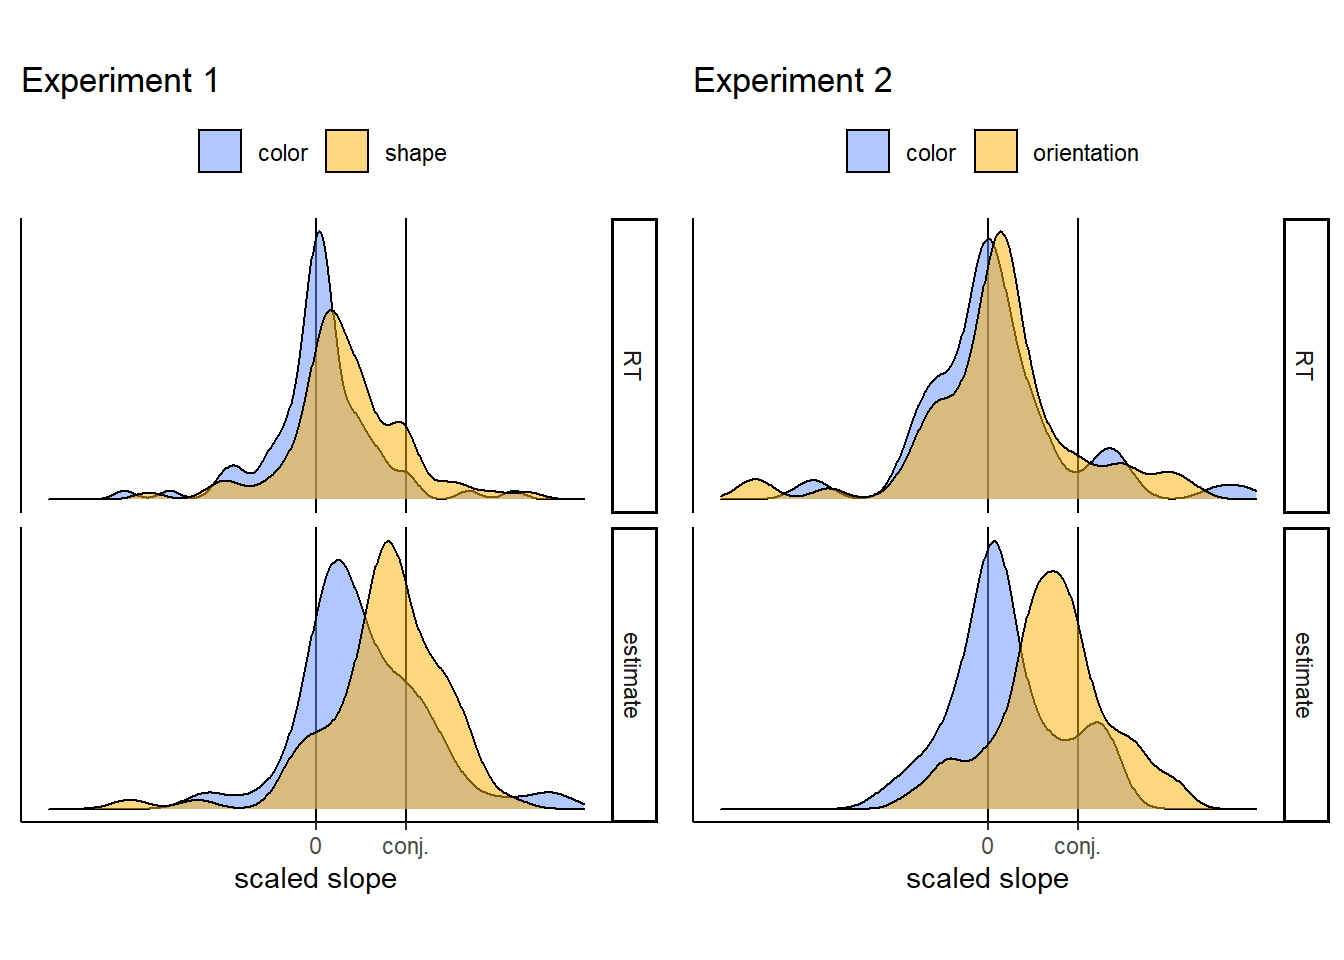
Figure 2.3: Normalized slopes for feature searches in Experiments 1 (left) and 2 (right). Search and estimate slopes were normalized with respect to conjunction slopes, to yield subject specific estimates.
To decide between these two options, we focused on the slopes for shape and orientation. These searches were more efficient than conjunction search, but not as efficient as colour search. We tested if this efficiency gradient was represented in search time estimates of single individuals, or alternatively, emerged at the group level only. To this end, we scaled subject-specific RT and estimate slopes with respect to conjunction slopes \(\beta_{scaled}=\frac{\beta}{\beta_{conjunction}}\). If representations of search efficiency are dichotomous, single participants can represent shape search either as being equally difficult as conjunction search, or as equally easy as color search. This predicts that the distribution of scaled estimate slopes should peak either at 1 or at the same value as color search. Instead, scaled estimate slopes for both shape and orientation peaked at values lower than 1 and higher than color search, indicating a graded representation of search efficiency in the internal models of single subjects (See Fig. 2.3. Exp. 1: median: 0.85; mode: 0.92; One sided Wilcoxon test against 1: \(V = 914.00\), \(p = .040\); One sided Wilcoxon test against color slope: \(V = 1,488.00\), \(p = .047\). Exp. 2: median: 0.75; mode: 0.70; One sided Wilcoxon test against 1: \(V = 405.00\), \(p = .013\); One sided Wilcoxon test against color slope: \(V = 969.00\), \(p = .001\)).
2.3 Experiments 3 and 4: complex, unfamiliar stimuli
In Experiments 1 and 2 an internal model of visual search allowed participants to accurately estimate how long it would take them to find a target stimulus in arrays of distractor stimuli. Participants had insight into the set-size effect and into the fact that conjunction searches are more difficult than feature searches. We also found that participants’ internal models of visual search represented search efficiency along a gradient, and were systematically biased to overestimate the effect of set-size, even in feature searches in which the number of distractors had no effect on search time.
In Experiments 3 and 4 we asked how rich this model is, by using displays of complex stimuli with which participants are unlikely to have any prior experience (letters from a medieval Alphabet and from the Futurama TV series). Here, insight into the set size effect and its absence in feature searches would not be useful for generating accurate search time estimates. Instead, participants’ internal model of visual search must be capable of extracting relevant features from rich stimuli, and use these features to generate stimulus-specific predictions based on some intricate model of how visual search works. Using these more complex stimuli further allowed us to ask if search-time estimates rely on person-specific knowledge. Exp. 4 followed Exp. 3 and was pre-registered (pre-registration document: osf.io/dprtk). Raw data and full analysis scripts are available at github.com/matanmazor/metaVisualSearch.
2.3.1 Participants
For Exp. 3, 100 participants (median reported age: 31; range: [19-65]) were recruited from the Prolific crowdsourcing web-service. The experiment took about 15 minutes to complete. Participants were paid £1.5. The highest performing 30% of participants received an additional bonus of £1. For Exp. 4, 200 participants (median reported age: 33; range: [19-81]) were recruited from the Prolific crowdsourcing web-service. We recruited more participants for Exp. 4 in order to have sufficient statistical power for our inter-subject correlation analysis. The experiment took about 8 minutes to complete. Participants were paid $1.27. The highest performing 30% of participants received an additional bonus of $0.75.
2.3.2 Procedure
The procedure for Experiments 3 and 4 was similar to that of Exp. 1 with several changes.
Stimuli were letters drawn by Mechanical Turk workers (Lake, Salakhutdinov, Gross, & Tenenbaum, 2011), instead of geometrical shapes (see Fig. 2.4). In Exp. 3, we used letters from the Alphabet of the Magi. In Exp. 4, we used letters from the Futurama television series as well as Latin letters. We explained to participants that they will search for a specific letter (the target letter) among copies of another letter (the distractor letter). In Exp. 3, both target and distractor were letters from the Alphabet of the Magi, and distractors were drawn by different Mechanical Turk workers. In Exp. 4, on half of the trials the target was a Latin letter and distractors were Futurama letters and on the other half the target was a Futurama letter and distractors were Latin letters. In these experiments, distractors were copies of the same letter drawn by the same Mechanical Turk worker. This was important for our visual search asymmetry analysis (see below).
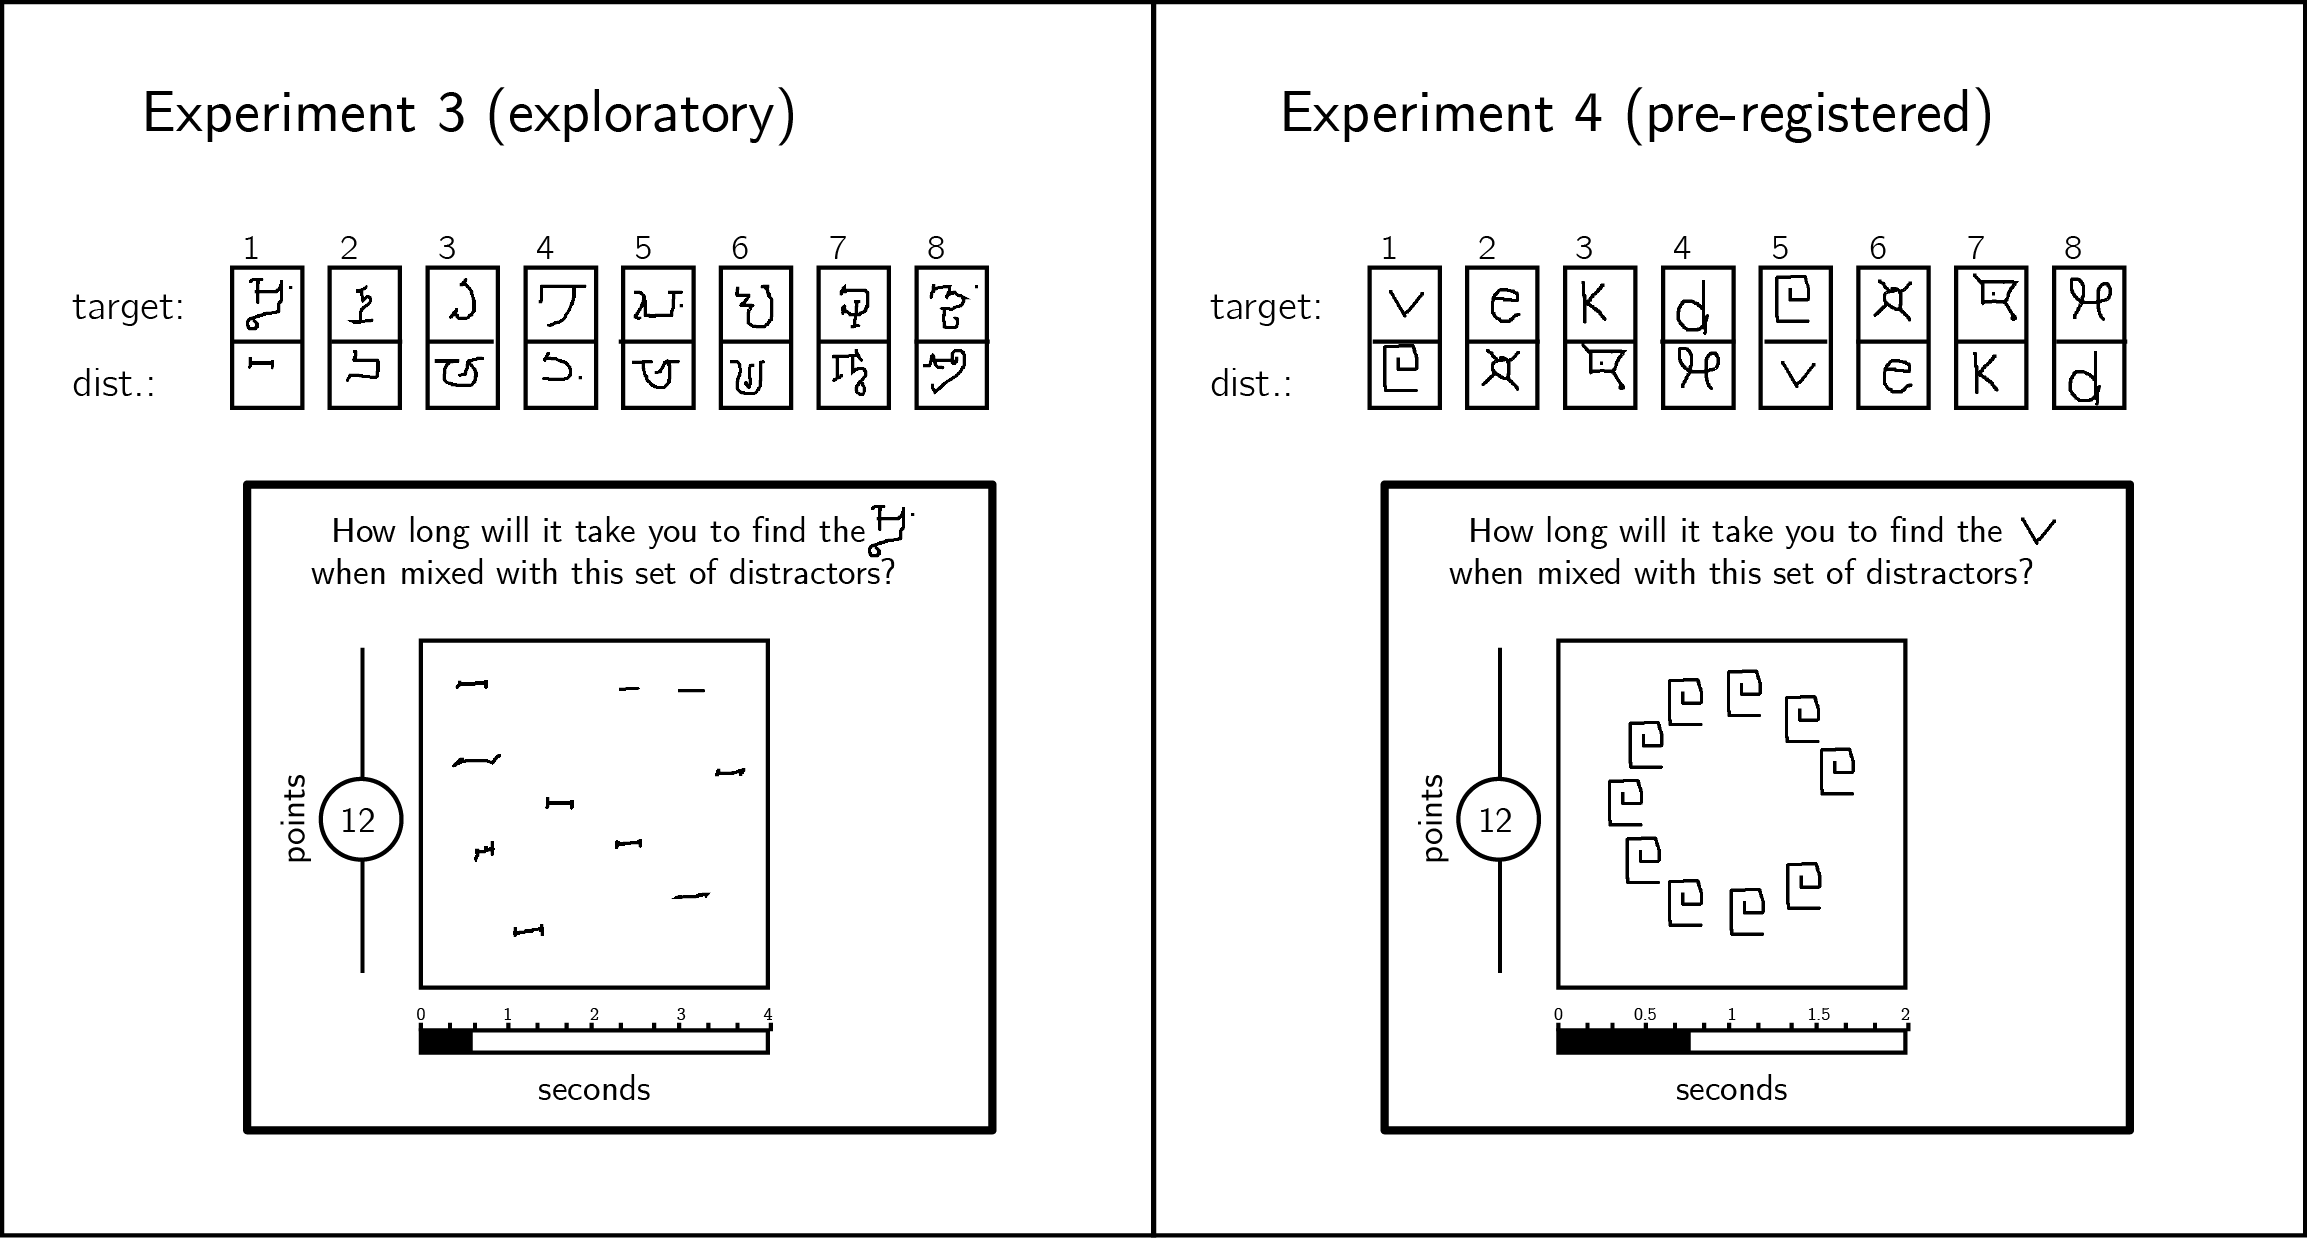
Figure 2.4: In Exp. 3, stimuli were characters from the Alphabet of the Magi, and distractors were drawn by different Mechanical Turk users. In Exp. 4, stimuli were characters from the Latin and Futurama alphabets. Stimulus pairs 1-4 and 5-8 are identical except for the target assignment. In Exp. 4, all distractors in a display were drawn by the same Mechanical Turk user, and were presented on an invisible clock face.
In the familiarization part, we used as target and distractors two letters from the Alphabet of the Magi (Exp. 3) and two letters from the Futurama alphabet (Exp. 4). Importantly, these letters were only used for training, and did not appear in the Estimation or Visual search parts. In the Estimation part participants gave search time estimates for 8 search tasks, all involving 10 distractors, and in the Visual Search part they performed these search tasks. To minimize random variation in spatial configurations (which was important for the search asymmetry analysis), in Exp. 4 letters appeared on an invisible clock face. Finally, the report scale ranged from 0.1 to 4 seconds in Exp. 3 and to 2 seconds in Exp. 4.
2.3.3 Results
Accuracy in the visual search task was high in both experiments (Exp. 3: \(M = 0.89\), 95% CI \([0.86\), \(0.92]\); Exp. 4: \(M = 0.97\), 95% CI \([0.96\), \(0.98]\)). Error trials and visual search trials that took shorter than 200 milliseconds or longer than 5 seconds were excluded from all further analysis. Participants were excluded if more than 30% of their trials were excluded based on the aforementioned criteria, leaving 88 and 200 participants for the main analysis of Experiments 3 and 4, respectively.
Estimation accuracy
In both experiments, search time estimates were positively correlated with true search times (within-subject Spearman correlations in Exp. 3: \(M = 0.44\), 95% CI \([0.37\), \(0.52]\), \(t(86) = 12.16\), \(p < .001\); Exp. 4: \(M = 0.10\), 95% CI \([0.05\), \(0.15]\), \(t(191) = 3.67\), \(p < .001\); see Figures 2.5 and 2.7A). The correlation between search time and search time estimates was significantly weaker in Experiment 4 (\(\Delta M = 0.35\), 95% CI \([0.26\), \(0.43]\), \(t(181.02) = 7.60\), \(p < .001\))). This difference in correlation strength is likely the result of a narrower range of search times in Exp. 4 (with median search times 566 - 684 ms, per display) than in Exp. 3 (649 - 1615 ms).
Importantly, in both experiments all searches involved exactly 10 distractors, so a positive correlation could not be driven by the effect of distractor set size. Furthermore, since participants had no prior experience with our stimuli, their estimates could not have been informed by explicit knowledge about specific letters (‘The third letter in the Alphabet of the Magi pops out to attention when presented between instances of the fourth letter,’ or ‘the fifth letter in the Futurama Alphabet is difficult to find when presented among ds’). These positive correlations reveal a more intricate knowledge of visual search. Our next two analyses were designed to test whether estimates were based on person-specific knowledge, and whether their generation involved a simulation of the search process.
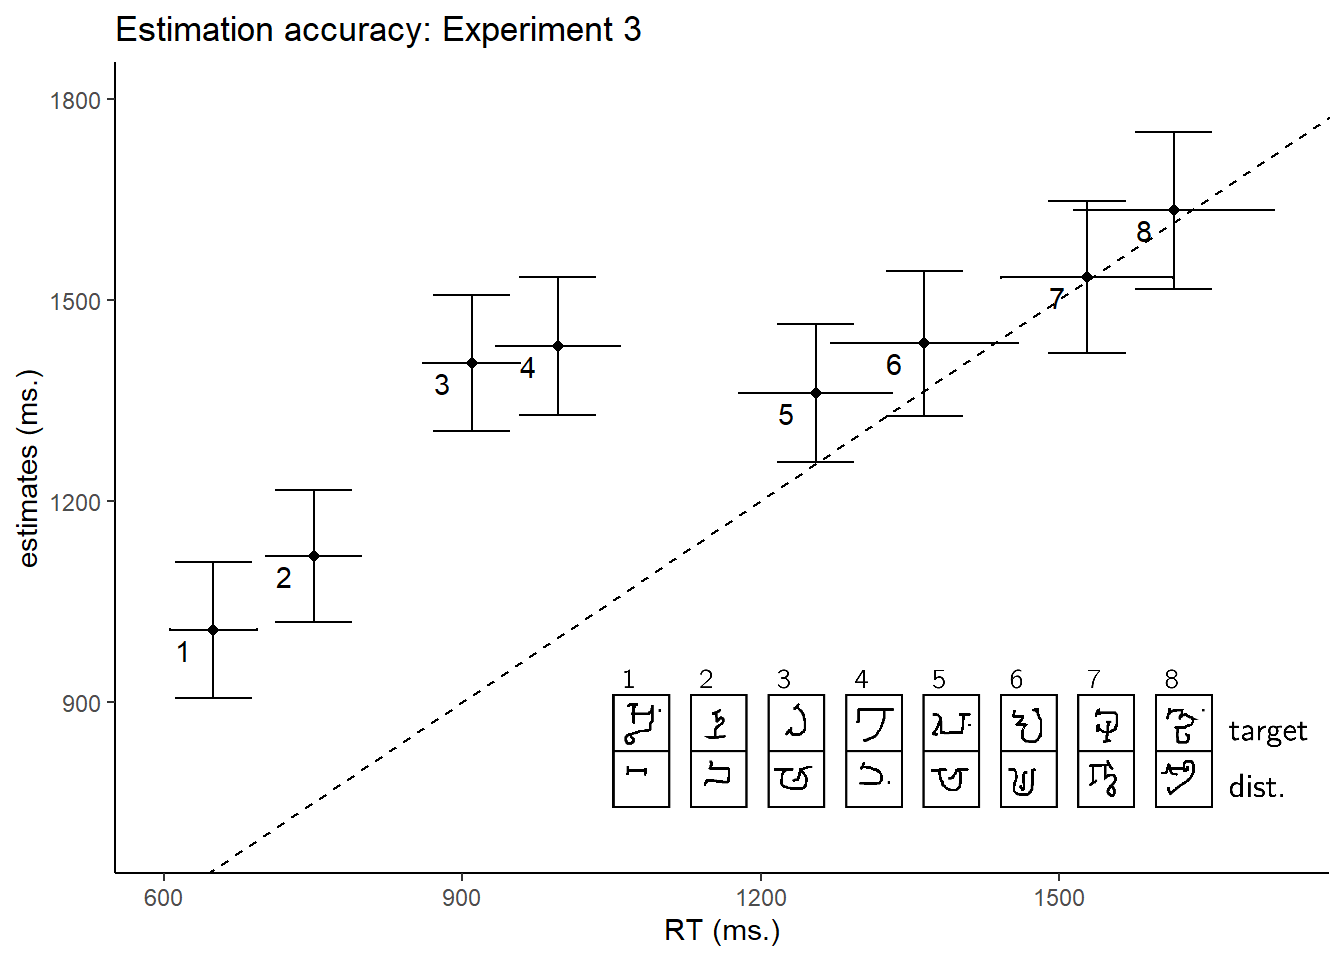
Figure 2.5: Estimated search times plotted against true search times in Experiment 2. The dashed line indicates \(y=x\). Legend: each search task involved searching for one Omniglot character (top letter) among ten tokens of a second Omniglot character, drawn by 10 different MTurk workers (bottom letter).
Cross-participant correlations
We chose unfamiliar letters as stimuli for Experiments 3 and 4 in order to make heuristic-based estimation more difficult, and to encourage an introspective estimation process. If participants were using idiosyncratic knowledge about their own attention, we would expect to find higher correlations between their search time estimates and their own search times (self-self alignment), compared to with the search times of a random surrogate participant (self-other alignment). To test this, we ran a non-parametric permutation test, comparing self-self and self-other alignment in prospective search time estimates. In Exp. 3, a numerical difference between self-self (mean Spearman correlation \(M_r=\) 0.44) and self-other alignment (\(M_r=\) 0.41) was marginally significant (\(p_{perm}=\) 0.06). In Experiment 4, we pre-registered this analysis and found a significant advantage for self-self alignment compared with self-other alignment (see Fig. 2.6; mean Spearman correlations for self-self \(M_r=\) 0.10 and self-other \(M_r=\) 0.04, \(p_{perm}=\) 0.01). We interpret this result as indicating that at least some of participants’ internal model of visual search builds on idiosyncratic knowledge about their own attention.
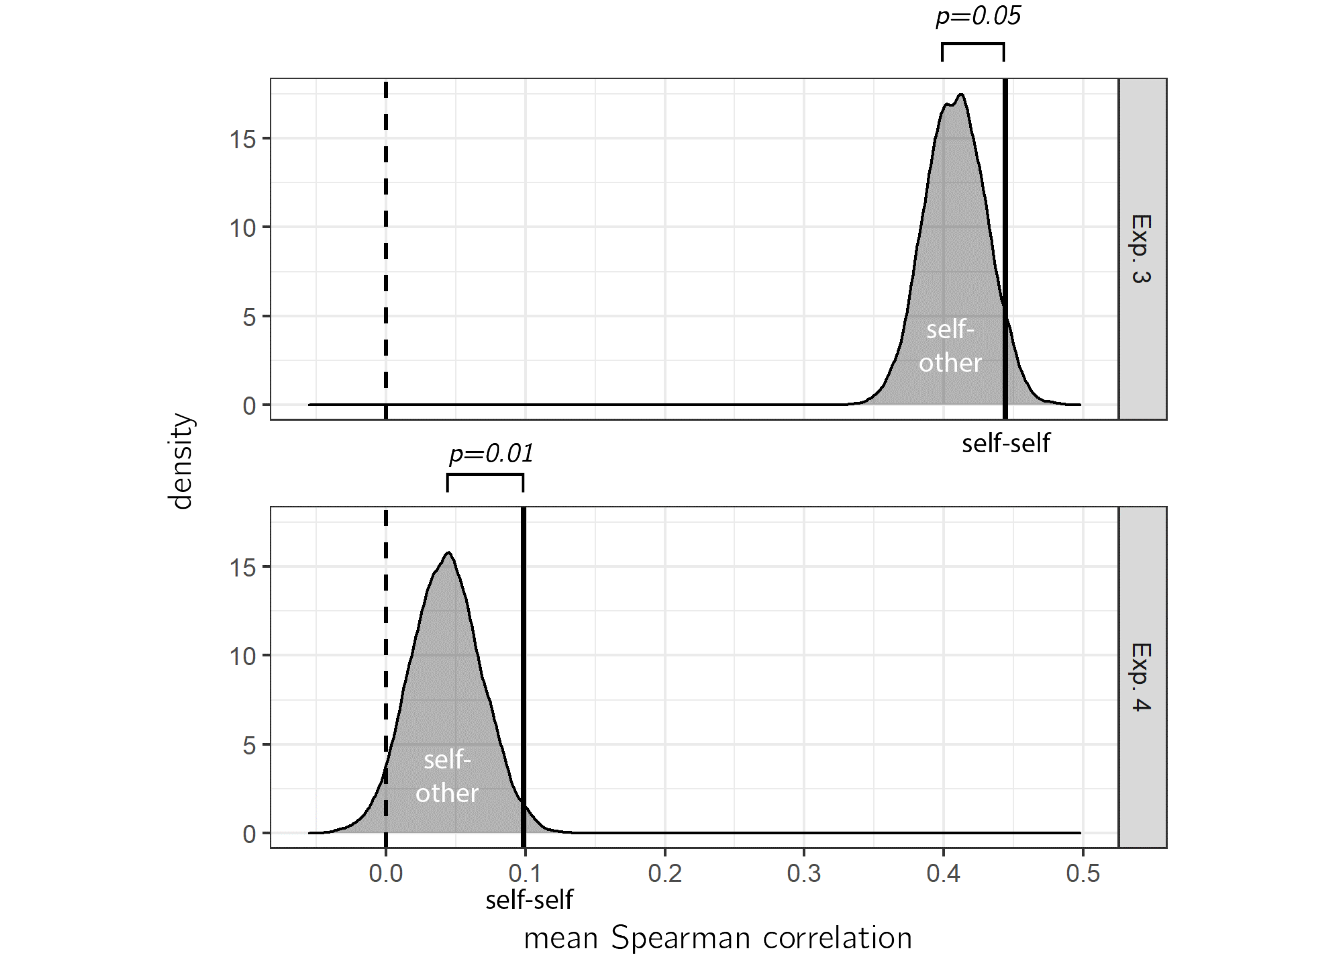
Figure 2.6: True correlation between estimates and search times (self-self alignment, vertical lines) plotted against a null distribution of correlations, when matching the estimates of each participant with the search time of a random surrogate participant (self-other alignment).
Estimation time
We next looked at the time taken to produce search time estimates in the Estimation part. We reasoned that if participants had to mentally simulate searching for the target in order to generate their search time estimates, they would take longer to estimate that a search task will terminate after 1500 compared to 1000 milliseconds. This is similar to how a linear alignment between the degree of rotation and response time in a mental rotation task was taken as support for an internal simulation that evolves over time (Shepard & Metzler, 1971). We find no evidence for within-subject correlation between estimates and the time taken to deliver them, not in Exp. 3 (\(t(86) = 0.40\), \(p = .692\)) and not in Exp. 4 (\(t(191) = 0.74\), \(p = .458\)). However, given that estimation times were three times longer than search time estimates (median time to estimate = 5 seconds in Exp. 3 and 3 seconds in Exp. 4), a simulation-driven correlation may have been masked by other factors that contributed to estimation times, such as motor control over the report slider.
Visual search asymmetry
In Exp. 4, we put to the test an alternative interpretation for the remarkable alignment between search time and search time estimates that we observed in Exp. 3. We considered the possibility that participants were relying on a heuristic: since search time generally inversely scales with the perceived similarity between the target and distractor stimuli, participants could achieve high accuracy in their estimates by basing them not on an intuitive theory of visual search, but on their impressions of similarity between the stimulus pairs. If all participants know about their visual search behaviour is that searches are harder the more similar the target and distractor are, simply being able to rate the similarity between pairs of stimuli would produce a good alignment between search times and their estimates.
To test if this was the case, we leveraged a well-established phenomenon in visual search: subjects are generally faster detecting an unfamiliar stimulus in an array of familiar distractors compared to when the target is familiar and the distractors are not (Malinowski & Hübner, 2001; Shen & Reingold, 2001; Zhang & Onyper, 2020). This asymmetry cannot be captured by a similarity-based heuristic (at least if similarity is represented as a symmetric property, cf. Tversky, 1977). In Exp. 4, participants were presented with pairs of familiar and unfamiliar letters, and estimated their search time for finding the familiar letter among unfamiliar distractors and vice versa. This allowed us to ask if their internal models of visual search were solely based on visual similarity between the target and distractor stimuli.
In addition to extracting correlation between search times and search time estimates, we extracted the same correlations after inverting the identity of the target and distractor stimuli in the estimates, but not in the actual search times. For example, instead of comparing search times for finding the letter v among 10 square spiral letters (stimulus pair 1) with estimates for the same search, we compared it with estimates for finding one square spiral letter among 10 v’s (stimulus pair 5). If estimates were affected by the assignment of stimuli to target and distractor, this inversion should attenuate the correlation, but if visual search estimates reflected a symmetric notion of similarity the correlation should not be affected.
Inverting the target/distractor assignment dropped the correlation between estimates and search time to zero (\(M = -0.01\), 95% CI \([-0.06\), \(0.04]\)), significantly lower than the original correlation (\(M_d = 0.10\), 95% CI \([0.03\), \(0.18]\), \(t(191) = 2.63\), \(p = .009\); see Fig. 2.7B). This is in contrast to what is expected if search time estimates reflected symmetric similarity judgments, and in line with an interpretation of our findings as evidence for a rich internal model of visual search.
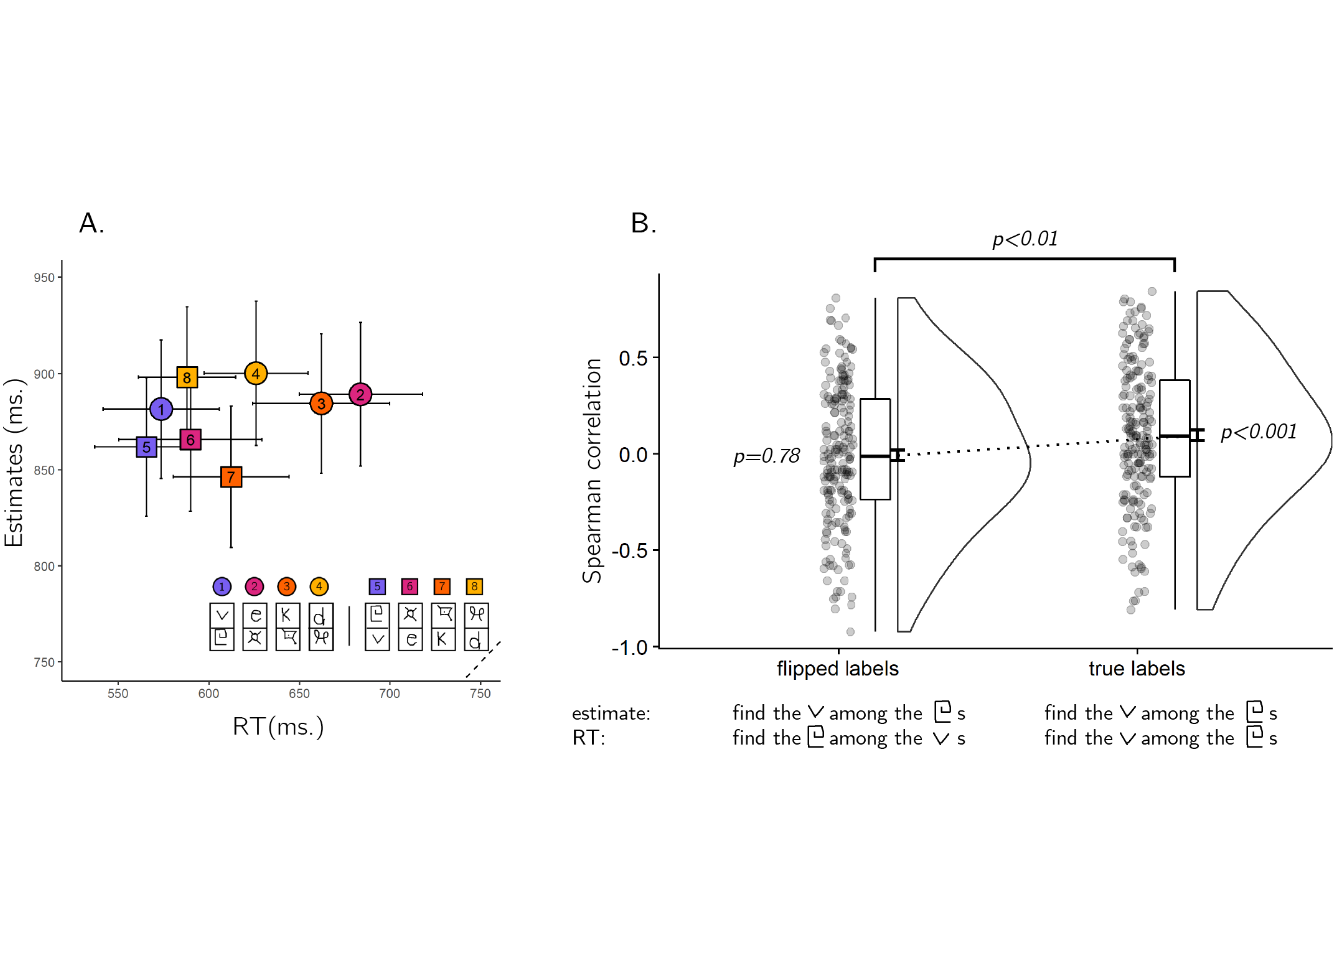
Figure 2.7: A. Median estimated search times plotted against true search times in Exp. 4. The dashed line indicates y=x. Legend: each search task involved searching for one character (top letter) among ten tokens of a different character (bottom letter). In four searches, the target character was from the Latin alphabet (circles), and in the other four from the Futurama alphabet (squares). Search pairs that involved the same pair of stimuli with opposite roles are marked by the same color. B. Spearman correlations between estimates and search times for true labels (upper panel) and target-distractor flipped labels (lower panel) in Exp. 4. Spearman correlations significantly dropped, indicating that participants were aware of the search asymmetry for stimulus familiarity.
2.4 Discussion
Over more than four decades of research on spatial attention, experiments where participants report the presence or absence of a target in a display revealed basic principles such as the set-size effect (A. Treisman, 1986; A. Treisman & Sato, 1990; J. M. Wolfe, 1998), the advantage for feature search over more complicated conjunction and spatial configuration searches (A. Treisman, 1986; A. Treisman & Sato, 1990), and asymmetries in the representations of visual features (Malinowski & Hübner, 2001; Shen & Reingold, 2001; A. Treisman & Souther, 1985). Some of these findings are intuitive, but others are more surprising, suggesting that even without training in psychology, people have a set of expectations and beliefs about their own perception and attention, and about visual search more specifically.
Here we measured these expectations and their alignment with actual visual search behavior. In four experiments, we show that naive participants provide reasonably accurate prospective estimates for their search times. In line with previous reports, prospective search time estimates reflected accurate knowledge of the set size effect and differences in efficiency between feature and conjunction searches (Levin & Angelone, 2008; Miller & Bigi, 1977). We asked whether participants categorically distinguish ‘easy’ from ‘hard’ searches, or alternatively represent search efficiency along a continuum. The estimates of single participants revealed a graded representation of search efficiency, indicating metacognitive knowledge that is on par with contemporary theories of visual search such as Guided Search models. Furthermore, participants provided accurate search time estimates for complex stimuli and displays with which they had no prior experience, and had metacognitive insight into the search asymmetry for familiar and unfamiliar stimuli.
In Exp. 4, we show that this internal model of visual search is person-specific: participants’ predictions fitted better their own search times compared to the search times of other participants. The fact that this model is not generic suggests that it is learned or calibrated based on first-person experience. Humans accumulate observations not only of external events and objects, but also of their own cognitive and perceptual states. Specifically, subjects have been shown to notice when their attention is captured by a distractor (Adams & Gaspelin, 2021) even in the absence of an overt eye movement (Adams & Gaspelin, 2020). These observations can then be integrated into an internal model or an intuitive theory: which items are more or less likely to capture attention, under what circumstances, etc. Future research into the development of this simplified model and its expansion based on new evidence [for example, by measuring intuitions before and after exposure to some evidence; Bonawitz, Ullman, Bridgers, Gopnik, & Tenenbaum (2019)] is needed to understand the relation between metacognitive monitoring of attention and metacognitive knowledge of attentional processes.
This relates to recent theoretical and empirical advances underscoring the utility of keeping a mental self-model, or a self-schema for attention control (Wilterson et al., 2020), social cognition (Graziano, 2013) , phenomenal experience (Metzinger, 2003), and inference about absence (Mazor, 2021; Mazor & Fleming, 2021). For example, knowing that a red berry would be easy to find among green leaves, a forager can quickly decide that a certain bush bears no ripe fruit. Alternatively, knowing that a snake would be difficult to spot in the sand, they might allocate more attentional resources to scanning the ground. Experiments 3 and 4 show that this knowledge is more than a set of heuristics or rules, but reflects an intricate internal model of spatial attention that can be applied to unseen stimuli in novel displays, and is tailored to one’s own perceptual and cognitive machinery.
Our final question concerned the structure of this internal model: is it specified as a list of facts and laws [similar to how the acquisition of knowledge about mental states between the ages of 2 and 4 was described as the development of a scientific theory; Gopnik & Meltzoff (1997)], or alternatively as an approximate probabilistic model that can be used to run simulations [similar to the physics engine model of intuitive physics; Battaglia, Hamrick, & Tenenbaum (2013)]? We found no direct evidence for a simulation account in the time taken to produce search time estimates. Nevertheless, participants’ ability to provide accurate estimates for displays of unfamiliar stimuli, and the better alignment of their estimates with their own search behavior compared to the search behavior of other participants, provide some indirect support for a simulation account - one that is based on a schematic version of one’s own attention. Still, we cannot exclude rule-based implementations of this internal model that are rich in detail and are based on one’s first-person experience, without involving a simulation.
One important limitation of our current design is its reliance on explicit estimates, which may have potentially resulted in underestimating the richness and accuracy of these internal models. For example, in Experiments 1 and 2 participants’ prospective estimates showed no metacognitive insight into the pop-out effect for color search. This does not necessarily mean that this information was misrepresented in their internal model. Instead, our numeric report scheme may have encouraged participants to adopt an analytical disposition to the problem, rather than relying fully on their intuitions. In support of this, in Chapter 1 a pop-out effect for color absence in the first few trials of a visual search task in interpreted as indicating accurate implicit metacognitive knowledge of the pop-out effect for color presence.
Together, our results reveal an alignment between prospective search time estimates and search times. This alignment places a lower bound on the richness and complexity of participants’ internal model of visual search, and of attention more generally, and opens a promising avenue for studying humans’ intuitive understanding of their own mental processes.